Severe Weather Analysis Model

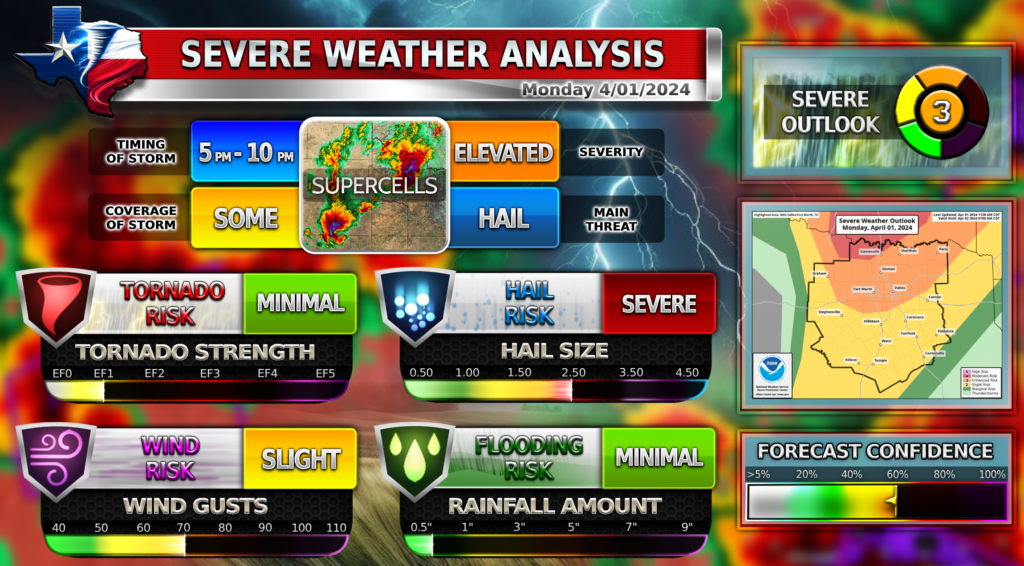
Texas Weather Center creates this Severe Weather Analysis model based on several sources of data, including Pivotal Weather, National Weather Service, and Storm Prediction Center. WC will change this model several times up until the date of the storm to ensure the most accurate prediction. Check out the information below to understand each section of WC’s model.
Timing of Storm
This box shows the expected time frame you can expect storms to arrive in the DFW area. It usually is a pretty wide frame of time.
Coverage of Storm
This box indicates how widespread the severe storms will be in the area. More coverage means more people are likely to see this severe weather. Less coverage usually indicates very isolated severe weather events only for a few select areas.
Severity
This box displays the SPC Outlook layer that is currently over the DFW area.
Main Threat
This box displays which severe weather hazard is the main threat: Hail, Tornado, Damaging Winds, or Flooding.
Storm Type
This box is in-between the other 4 boxes. It shows an image of the expected storm type: Intense Supercells, Supercells, Scattered Storms, Isolated Storms, Squall Line.
Severe Outlook
A radial that displays the current SPC Outlook over the DFW area. The levels are 1-5:
(1) Marginal Risk:
Hazards: Isolated severe storms with limited wind and hail potential.
(2) Slight Risk:
Hazards: Scattered severe storms with a risk of damaging winds, large hail, and isolated tornadoes.
(3) Enhanced Risk:
Hazards: Numerous severe storms with a significant risk of widespread damaging winds, large hail, and a few tornadoes.
(4) Moderate Risk:
Hazards: Widespread severe storms with a higher likelihood of widespread damaging winds, large hail, and multiple tornadoes.
(5) High Risk:
Hazards: An extremely high risk of widespread and intense severe storms, including widespread damaging winds, large hail, and numerous tornadoes, including strong tornadoes.
SPC Map
Displays a map of the SPC Outlook for the North Texas region.
Forecast Confidence
Shows the confidence WC has in its forecast based on several external resources WC is using. The lower the % is, the more likely for unforeseen events to happen with the weather. The higher the % is, the more likely what is forecasted will actually happen.
Hazard Boxes
Features an advanced block including the severity of that hazard and also the maximum strength rating.
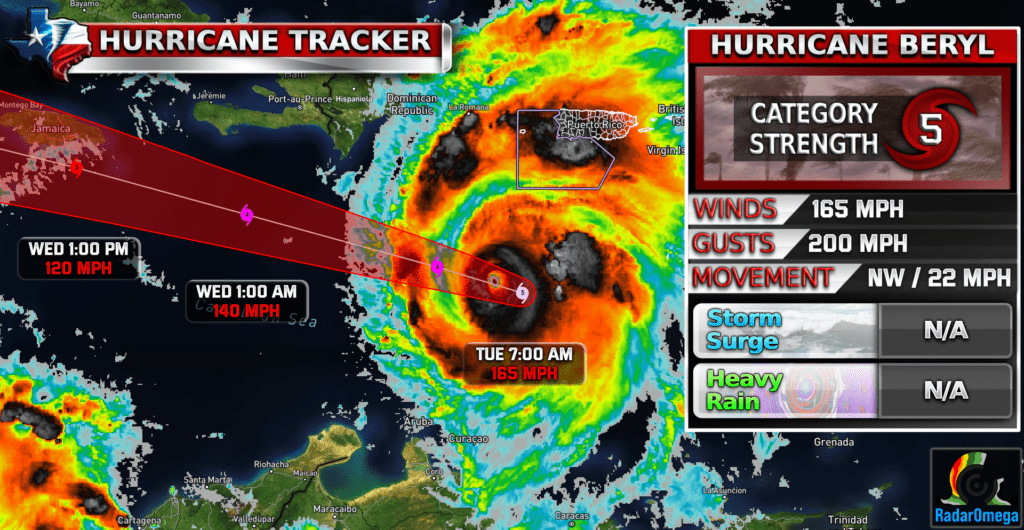
Hurricane Tracking Model

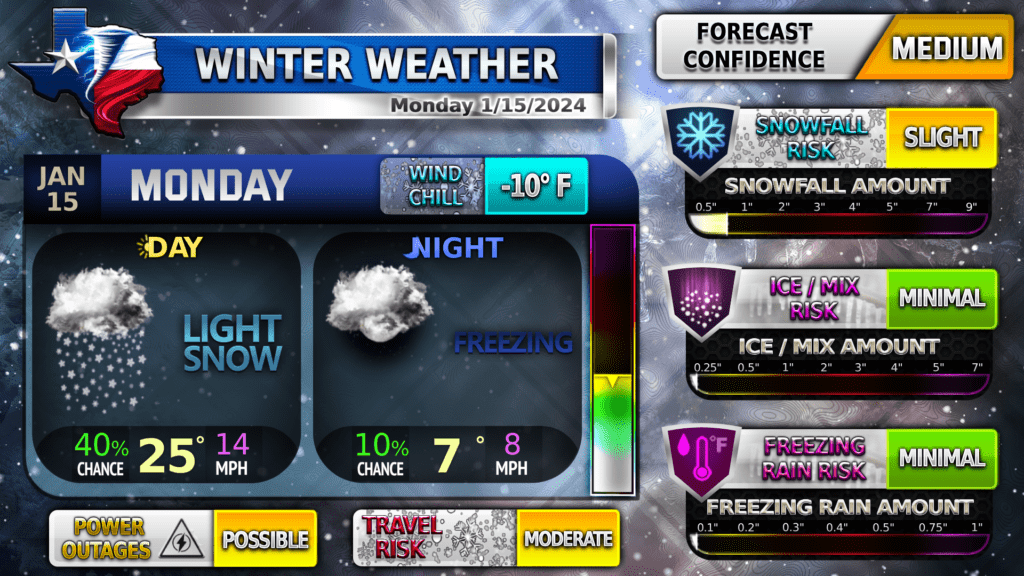
Winter Weather Model

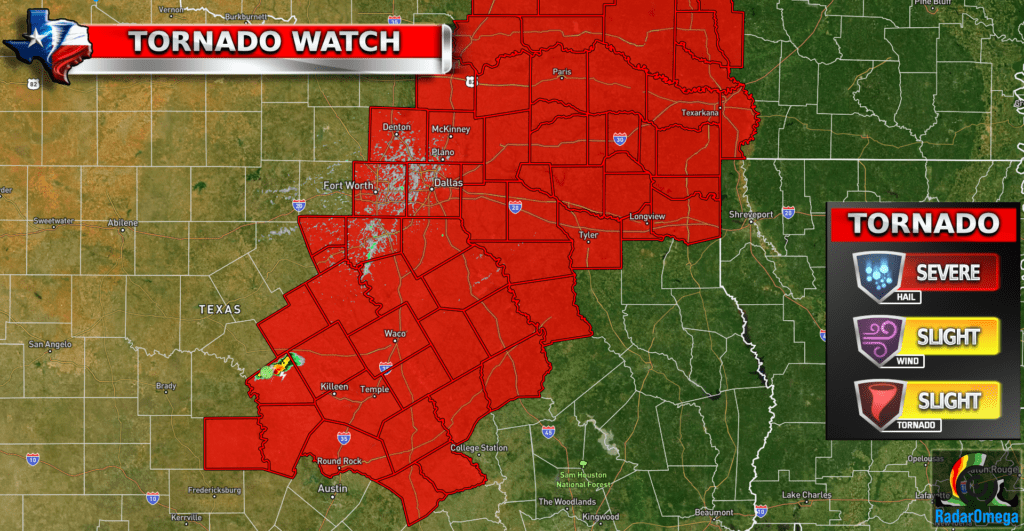
Weather Watch Model
